Grow light coverage numbers are often treated as fixed specifications, but in real-world facilities they rarely tell the full story. A stated 4×4 or 5×5 coverage rating may look clear on paper, yet it provides almost no insight into how light is actually distributed across the canopy.
This is why professional lighting design relies on PPFD maps. PPFD mapping reveals how photons behave across a space, exposing distribution patterns, uniformity issues, and performance gaps that coverage claims alone cannot show.
Why Coverage Numbers Often Mislead
Coverage Describes Area, Not Distribution
Coverage ratings only describe the physical footprint a fixture can illuminate. They do not account for how evenly photons are distributed within that area. Two fixtures with identical coverage specifications can produce radically different results once intensity, bar spacing, and mounting height are introduced.
In practice, coverage without PPFD context hides hotspots, edge falloff, and uneven overlap between fixtures—factors that directly affect growth consistency and operational predictability.
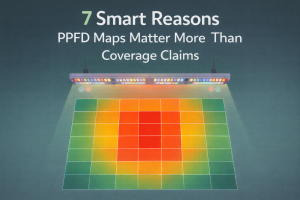
PPFD Maps Reveal Real Photon Behavior
PPFD maps visualize photon density across the entire grow surface. Instead of a single number, growers see gradients, peak zones, and low-intensity regions. This makes it immediately clear whether a lighting layout delivers usable light evenly or concentrates output in limited areas.
What appears to be “full coverage” on a spec sheet often collapses into a much smaller effective area once PPFD distribution is analyzed.
How PPFD Maps Improve Design Decisions
Uniformity Cannot Be Judged by Coverage Alone
Light uniformity is a distribution problem, not an output problem. A fixture may deliver high average PPFD while still producing poor uniformity if photons cluster near the center and decay rapidly toward the edges.
PPFD maps expose this imbalance immediately, allowing designers to evaluate uniformity ratios and adjust layout before inconsistencies translate into uneven development.
Mounting Height Changes the Entire Map
Mounting height has a dramatic effect on PPFD distribution. Lower heights increase peak intensity but shrink the effective coverage area. Higher mounting heights soften peaks and widen overlap but reduce total usable PPFD.
A PPFD map shows these trade-offs clearly, making it easier to identify the optimal height where distribution and intensity align with stage-specific targets.
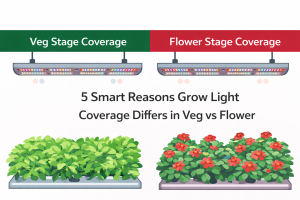
Veg and Flower Stages Require Different Distribution Profiles
Vegetative stages tolerate wider variation in photon density, which allows broader spacing and softer distribution. Flowering stages, however, amplify small inconsistencies as canopy density increases and light interception becomes uneven.
PPFD maps reveal how the same fixture behaves differently across stages, explaining why a layout that performs well in veg often needs adjustment once plants transition into flower.
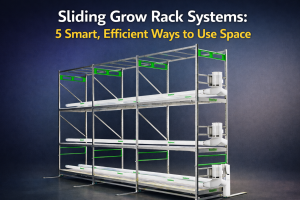
Facilities that use vertical racks or dedicated under-canopy lighting depend on PPFD maps to confirm that both upper and lower canopy layers receive usable, balanced intensity.
Why Professionals Trust Maps Over Marketing
Fixture Design Shapes Distribution More Than Wattage
Bar spacing, diode placement, beam angle, and optical design define how photons overlap. These structural characteristics determine whether a fixture produces smooth distribution or sharp intensity gradients—something coverage numbers never communicate.
PPFD maps translate fixture design into real-world performance data that can be compared objectively.
Adjustable Spectrum Fixtures Benefit Most From Mapping
Modern adjustable spectrum grow lights introduce additional control variables. Different channels influence photon behavior, canopy response, and distribution patterns across stages.
When spectrum can be tuned independently, PPFD mapping becomes essential for aligning output with plant response rather than relying on static coverage assumptions. This systems-level approach is a core principle behind how LED grow lights are selected and deployed in professional environments.
Commercial Facilities Design for Predictability
Large-scale operations value consistency more than theoretical maximum output. PPFD maps reduce uncertainty by showing how light behaves before installation, minimizing trial-and-error and preventing costly layout mistakes.
This is why engineers, integrators, and facility operators evaluate PPFD maps as a primary decision tool rather than relying on advertised coverage alone.
Conclusion
Coverage specifications describe space, but PPFD maps describe performance. By visualizing photon distribution, mapping reveals uniformity, intensity balance, and stage-specific behavior that coverage numbers cannot capture.
Facilities that rely on PPFD mapping make better-informed decisions, achieve more consistent results, and build lighting systems that perform predictably from vegetative development through flowering. When mapping is combined with structured project planning and utility incentive support from partners such as Grow Lights Rebate, it becomes a powerful tool for both performance and long-term cost control.